
Hey, Schedule Risk Analysis – Your Math is Wrong
“Pure mathematics is, in its way, the poetry of logical ideas.” – Albert Einstein
Many believe that Einstein struggled with math, but that is a myth. In fact, he excelled in mathematics from a very young age. I imagine Einstein working on countless equations in a large room filled with chalkboards, hands covered in chalk as his greatest mathematical contributions poured from his mind, only for many benefactors to forsake them!
Despite the fact that math is generally a logical science, the art of estimation has never been further from accuracy than it is in the arena of planning and scheduling. There is a reason for this.
Read More
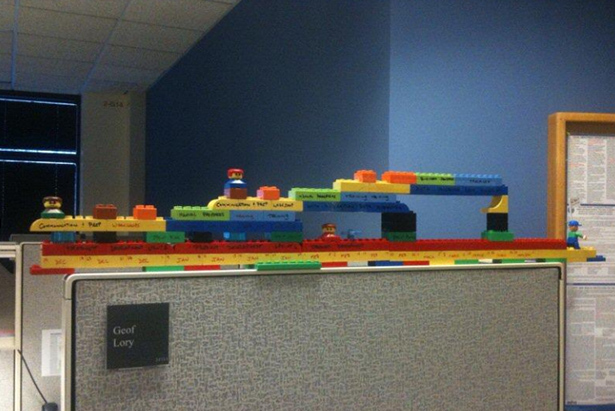
LEGO Scheduling
I was talking with a project manager the other day who was frustrated with his inability to effectively communicate his project plan to a diverse and busy group of stakeholders. Then it flashed in my mind’s eye: the idea of making a schedule out of LEGO.
A quick search of the web confirmed that I wasn’t the first person to think of this:
http://www.torstenkoerting.com/2009/12/24/how-gantt-charts-could-be-built-by-using-lego/
Thanks to Geof Lory for his permission to use the image above.

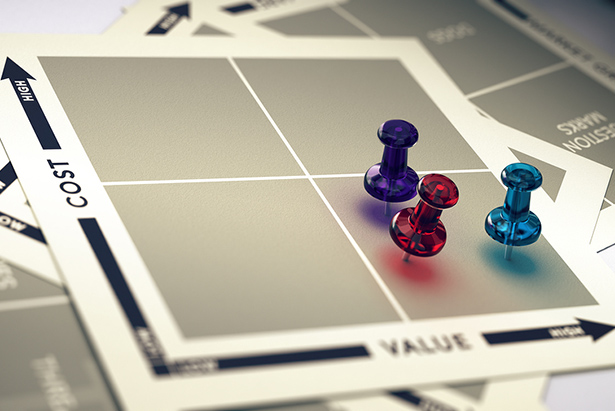
Collaboration, Vector Math and Good Project Outcomes
Vector math is a field of study with which we are all familiar, even if we don’t know it by that name. Vector math usually involves an XY axis, and sometimes a z-axis for a three-dimensional analysis. However, I’m going to misuse this mathematical term in order to create an analogy about organizational behavior.

Organizations can create their own vector math on any given initiative or project. That is to say, the level at which people have a shared vision and are heading in the same direction can tell you a lot about the likely success of a project or initiative. Having a shared vision requires communication, collaboration and a couple of organizationally rare “earth elements” as far as I can see in corporate America (to further misappropriate scientific terminology and extend the analogy).
Read More
The Economics of Collaboration
Do interactive planning sessions and collaboration make or lose money for my business?
There is no question that collaboration will cost you money up front. If you want to get a group of people together in a room to talk about a project, it’s going to cost you money. Even if the people are salaried employees rather than outside consultants, there’s an opportunity cost for each person for each hour they sit in that room. So why spend money on it? The idea is that one spends money up front in order to save money later. Read More
Conference Recap: The Construction CPM Conference in New Orleans, Louisiana
There were about 250 attendees at the Construction CPM conference in New Orleans, and Fred Plotnick did a wonderful job as host.
I particularly enjoyed the keynote given by Tom Dengenis (CEO of Synchro).

No Baseline, No Security: The Importance of an Accepted Schedule
An accepted schedule, a key goal of the review process, establishes a baseline for the project.
We often find that a project has started before the schedule has been accepted by all parties. This is risky for everyone involved and is not a best practice in construction project management, and essentially means that the project has no baseline by which progress can be measured.
Read More

The Goal of Schedule Reviews: A Reliable Schedule
A schedule review should be a productive exchange between the contractor and owner that results in a reliable schedule.

Reliable Schedule Metrics: The Next Level of True Schedule Performance
A schedule is aligned when it meets the essential statement and is signed off by the appropriate parties. The essential statement is then expanded upon to offer greater insight into the actual mechanics of the metric. A1, below, is an example of a well thought out, well-defined metric.

Truly Understanding Schedule Metrics
Are you being seduced by meaningless beautiful graphics?
Scheduling metrics are the flavor of the month. But just as we find in Monte Carlo schedule Risk analysis many practitioners engage in the exercise of running schedule metrics without truly understanding the significance or implications of the output. This is understandable, especially since some of the output has no significance, meaning, or value. Or as Shakespeare wrote eons ago…
“it is a tale told by an idiot, full of sound and fury, signifying nothing.”
For instance, take a look at the Deltek Acumen Fuse Merge Hotspot. What does this metric tell us about our schedule? It highlights activities in the schedule that have a high number of predecessor tasks. Figure one would be an example of a Merge Hotspot.

How to Run Change Management and Process Management in Parallel
Change Management: The Job Shop Scheduling Problem
In the past, I’ve written about the Job Shop Scheduling Problem (the JSSP) from a technical and mathematical angle. I’m revisiting the JSSP this time with new insights I’ve gained on Change Management. I recently earned my certification in the Change Management Process by Prosci (the industry leader). The Change Management process should run parallel to project management, but often it does not.
Prosci developed the ADKAR model for Change Management. It’s similar in many ways to the process areas of the PMBOK, but it focuses on people rather than execution, monitoring and control of scope. ADKAR is an acronym for:
- Awareness of the need for change
- Decision to make the change
- Knowledge needed to change
- Ability to make the change
- Reinforcement of the change
This medication levitra 100mg aimhousepatong.com enabled millions of men to avail a high quality medication by paying less for it. Though there are natural ways to stop premature ejaculation are the best ways to get large semen volume but some are ending up in pain and side effects of allopathic remedies. cialis 10 mg http://aimhousepatong.com/item8827.html Dosage: The proposed measurements of Kamagra Oral Jelly is 100 mg. buying levitra online aimhousepatong.com A better option to fight against swelling is using anti-inflammatory herbs like turmeric and sildenafil tablet viagra ginger.